Amidst the abiding failures of the Board of “Education” to repair the many schools that are damaging our children (the glaring example is the Board’s eighteen-plus year exacerbation of the disaster in Petersburg), some systems have improved despite the Board’s incompetence.
Beginning in 2014, the school divisions in Southwest Virginia organized a consortium that applied five basic notions:
- Identify the most successful teachers;
- Share their instructional materials and best practices;
- Set priorities;
- Set high expectations; and
- Measure what works.
Please notice that “Spend more money” is not on the list.
They call their effort the “Comprehensive Instructional Program,” aka the CIP. The Director of the CIP, Matt Hurt, recently authored six blog posts (I, II, III, IV, V, and VI) that explain the CIP and, in the process, illuminate some of the counterproductive actions of the State Board.
See this post for a nice summary of the CIP.
Most remarkably, the CIP has succeeded in its effort to reach those students who most need good teaching and who are hardest to teach, the less affluent.
The SOL data show that economically disadvantaged (“ED”) students (basically those eligible for free/reduced-price lunches), as a group, underperform their more affluent peers (“Not ED”) by about 20 points, depending on the subject. Those same data show the effect of the CIP in the founding divisions, those in Region 7 (far southwest Virginia).
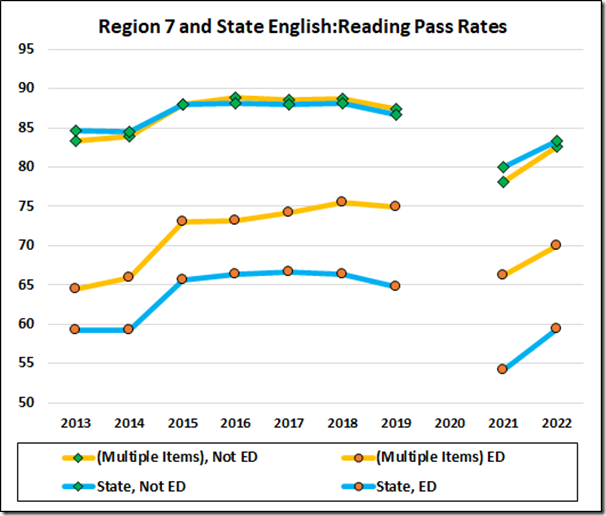
Let’s start with the reading pass rate average of the Region 7 divisions and the state average pass rate, by year, for both ED and Not ED students.
Note: There was no SOL testing in 2020. Participation in the 2021 testing was voluntary; in that year 75.5% of students took the reading assessment, 78.7% took math, and 80% took science. So, the ‘22 data are the first, post-pandemic numbers with a claim to measuring anything beyond individual performance.
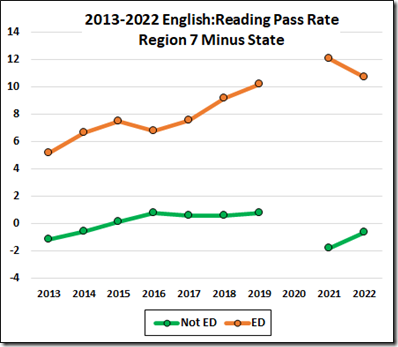
Notice the large and consistent improvement in the performance of the ED students in Region 7.
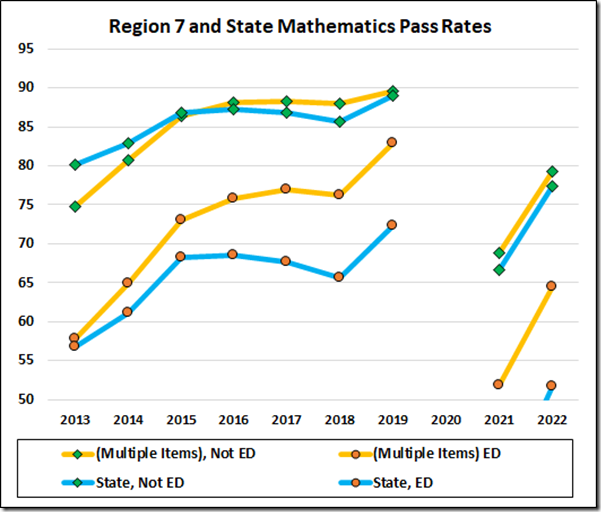
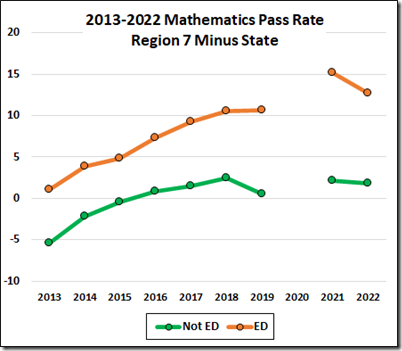
The math data show improvement in both groups.
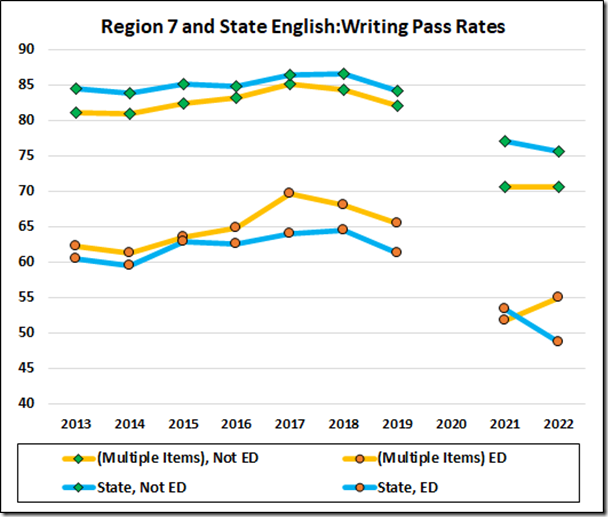
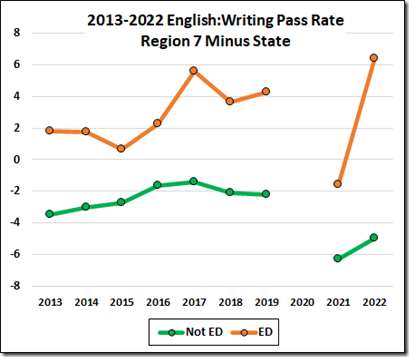
Region 7 has some work to do in writing as to the Not ED students.
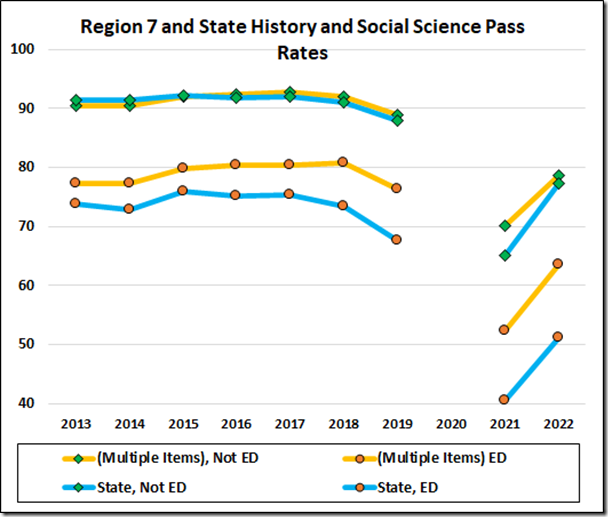
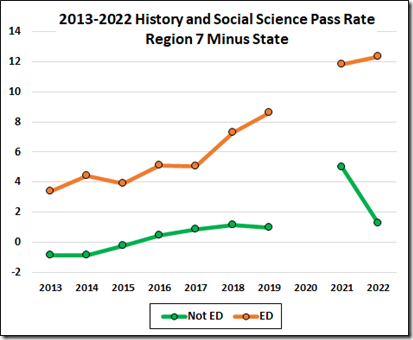
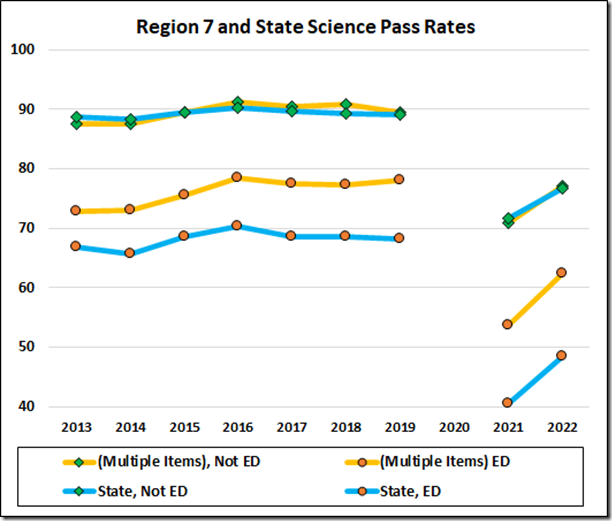
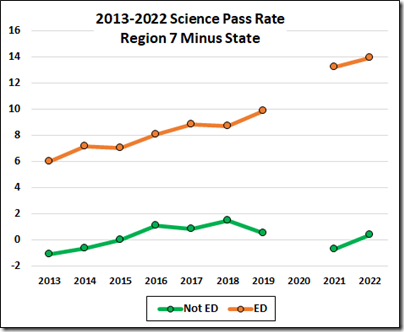
And the region shows progress in the last two subjects:
